Free Alternatives to MapChart: How Oh My Maps! Compares for Custom Maps
·4 min·View as Markdown
TagsWorld Map
Written byJordan Hale — Writer, Oh My Maps!
Contents
MapChart is the tool most people find first when they search for a way to colour a map online, and it is a genuinely capable one. This is not a “why we’re better” post; it is a straight comparison, so you can pick the right tool for what you are actually building. Where a claim about MapChart is made below, it is based on what its own site documents publicly, not a guess.
Where the two tools are similar
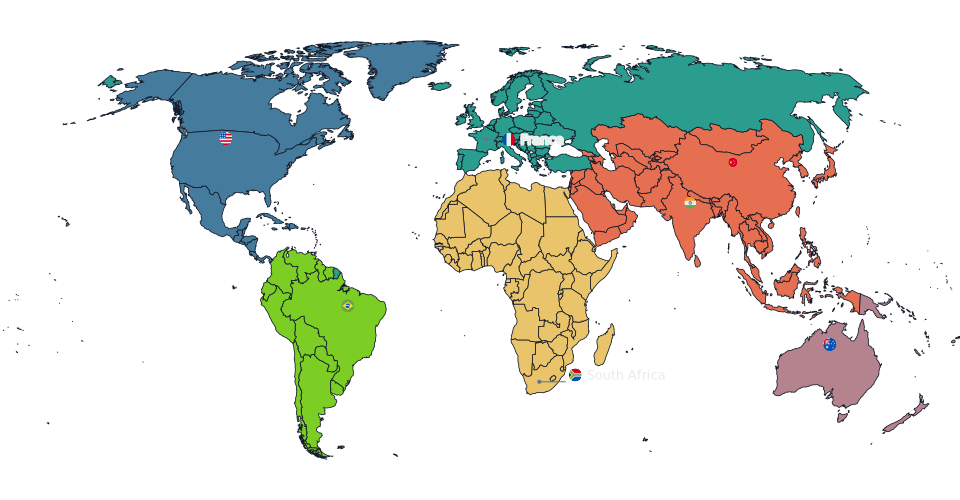
Both are free to use without creating an account, both let you paint regions by hand, both offer fill patterns (MapChart’s include dots and several widths of diagonal and vertical stripes; Oh My Maps! offers diagonal hatching and dots), both offer several map projections, and both let you share a finished map’s settings with a link. If your job is “colour a world map and send someone the link”, either tool gets it done.
See the difference for yourself. Open the editor and try the same map you were about to build elsewhere.
Open the editorWhere they differ
Maps beyond the world. Oh My Maps! is four separate editors, not one: the world (235 countries), Europe (51 countries and territories), Brazil (27 states) and the United States (50 states and DC), each with its own URL and its own dataset. A US or Brazil map here is not the world map cropped; it is drawn in a projection fitted to that specific territory (Albers USA for the United States, a conformal conic for Brazil), which keeps shapes honest in a way that dropping a world projection onto a cropped view cannot. MapChart’s projection list (Winkel Tripel, Robinson, Mercator, Mollweide and others, ten in total on its advanced world map) is oriented toward global maps.
A rotatable globe. Oh My Maps! includes an orthographic projection you can drag to rotate, putting any hemisphere at the centre. It is not on MapChart’s published projection list.
Data import workflow. Oh My Maps! lets you paste a CSV or TSV straight from a spreadsheet to build a choropleth map, with a preview that reports exactly which rows matched and which did not before anything is applied, and per-column decimal-separator detection to avoid a silent factor-of-a-thousand error. Full detail in how to create a choropleth map from spreadsheet data. MapChart links out to Google Sheets and Excel integrations for some of its maps; if that workflow matters to you, compare it directly against pasting a spreadsheet in the editor before deciding.
Export ceiling. MapChart’s advanced editor exports PNG, JPEG, SVG or PDF at up to 10,000 px on the long edge. Oh My Maps! exports PNG, JPEG, WebP or SVG at up to 8000 px, plus a WebP option MapChart does not list. If you specifically need a file larger than 8000 px or a PDF, MapChart’s ceiling is higher today.
Pricing. MapChart’s free tier is paired with a paid “MapChart Plus” tier for extra features, including saving maps to an account. Every feature in Oh My Maps! is free, with no paid tier and no account at all: nothing to sign up for, nothing to upgrade later.
When MapChart is the better fit
If your map needs a PDF export, a file above 8000 px, or one of MapChart’s ten world projections specifically, MapChart supports that today and Oh My Maps! does not. Regional and thematic map packs beyond the four covered here (a specific country’s provinces, for instance) may also live only on MapChart’s side; check its map list before assuming either tool has what you need.
When Oh My Maps! is the better fit
If you want a country-specific editor with a projection actually fitted to that country, a rotatable globe, a spreadsheet-paste workflow with an import preview, or simply want to be certain nothing is gated behind a paid tier, that is the case Oh My Maps! makes for itself.
Next steps
- The full tour of the editor is the place to start if this comparison tipped you toward trying it.
- Which map projection should you use? goes deeper on the projection trade-offs touched on above.
Ready to make yours? Oh My Maps! is free, runs in the browser and needs no sign-up. Your map is saved locally as you work, and exports carry no watermark.
Open the editor